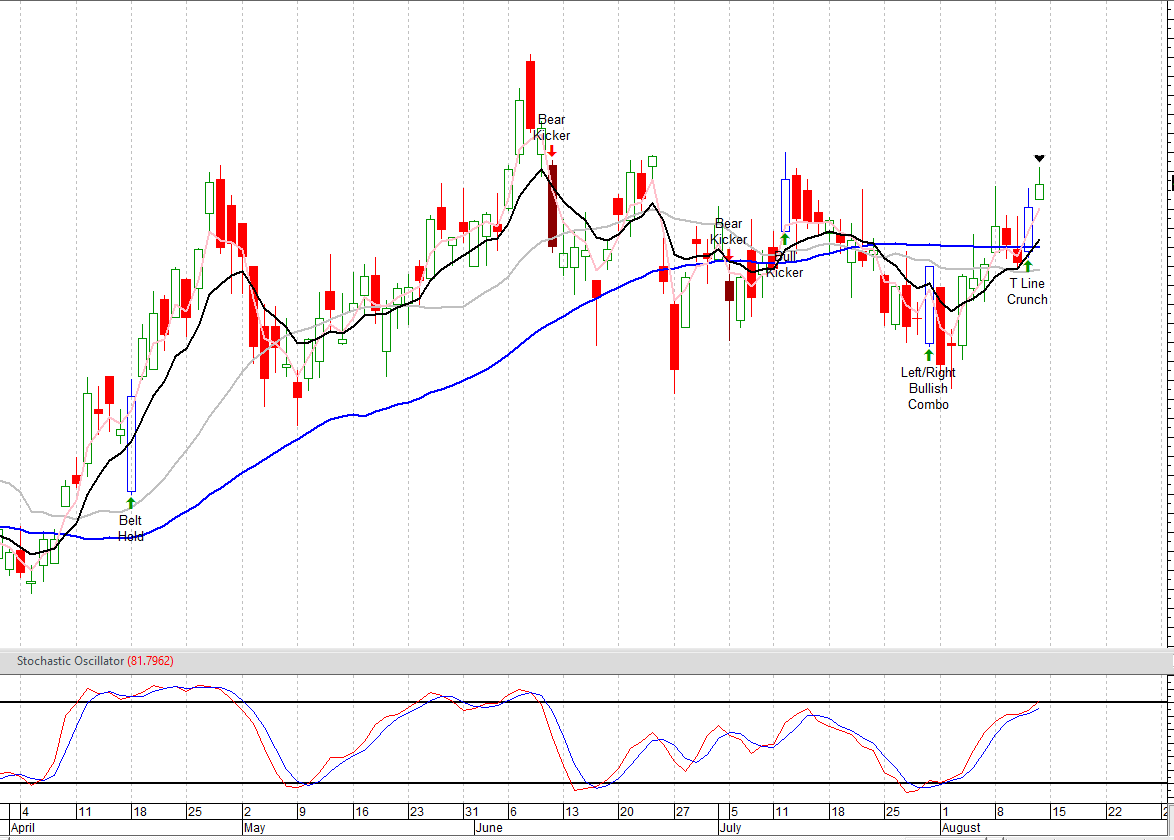
- Let me introduce you to another add-on that we sometimes use. It utilizes certain patterns and Candlesticks to produce buy and sell signals .Right now an ETF GASL received a buy signal on 11 of August that is called T-Line Crunch.
- The T-line crunch is a common bullish indicator that indicates when a potential breakthrough is about to occur. Also, it visually demonstrates that the bears cannot knock the trading levels down through the T-line. As long as a trend continues to close above the T-line (the black line), it is considered to be in an uptrend.
- One thing to be aware of with a T-Line run, sometimes during the the stock run that the price can get far from the T-Line and as the result the stock will trade sideways for a few days until it comes back to the T-Line and tests it, or other times, the come back of the price to T-line will happen dramatically in one day esp if the price is too far from the T-Line.
- As you can see in the chart the price of the GASL is a bit far from the T-Line, so keep in mind that GASL can also consolidates or fall to the T-line dramatically, before further uptrend.
No comments:
Post a Comment